Business intelligence and people data connected together for incredible insights – as easy as asking a question.

.png)


.png)
Instead of spending hours building reports to support your hypothesis, you can explore ideas in real-time with AI. Ask follow-up questions. Test different scenarios. Discover insights you never thought to look for. Access Guard security system ensures AI only surfaces the data each employee can see.


Instead of spending hours building reports to support your hypothesis, you can explore ideas in real-time with AI. Ask follow-up questions. Test different scenarios. Discover insights you never thought to look for. Access Guard security system ensures AI only surfaces the data each employee can see.

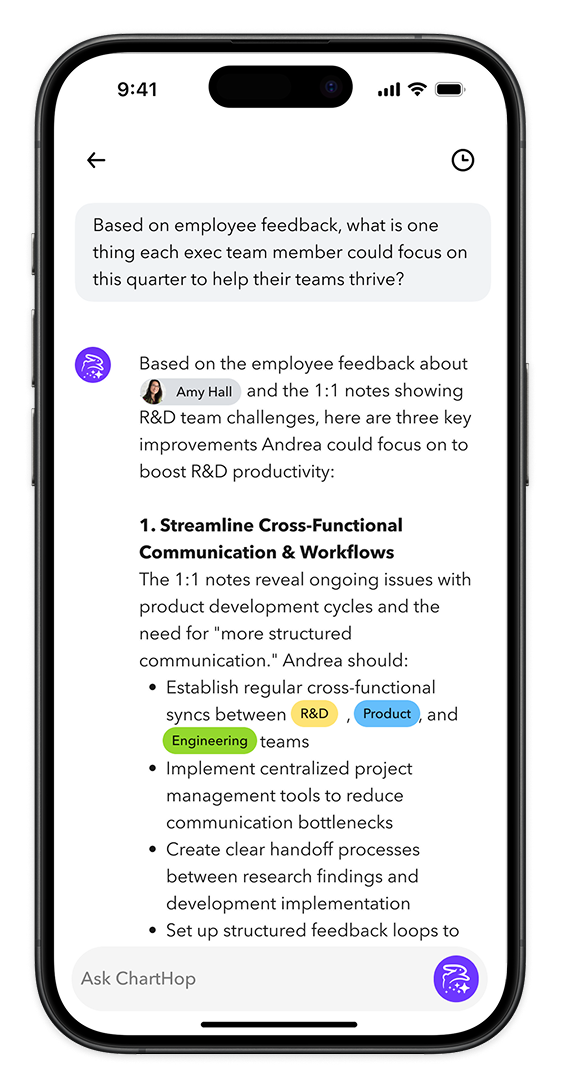


ChartHop’s Access Guard is a unique approach to AI data security, ensuring employees see only the data they are allowed to see—preventing AI from accessing data that sits outside a person’s role. And because ChartHop AI keeps organizational data private to each organization and never shares this data outside of ChartHop for AI model training, you can discuss the most sensitive topics with confidence that your data stays contained within ChartHop.