


Whether you’re navigating your organization, analyzing your people data, or creating a new survey, being able to configure data fields in ChartHop is critical to ensure you can surface the data that you need.
ChartHop comes with built-in data fields such as name or location, but you can also bring in additional data through integrations and spreadsheet uploads to then create your own fields to measure flight risk, equity vesting, remote work engagement, and more.
The latest updates to ChartHop modernize the data fields settings page to make it even easier to manage these fields and to find and interact with the data you use most.
In your day-to-day use of ChartHop, this means you can now organize related fields into categories and define the order in which categories appear so you can quickly find those fields in the column chooser wherever you populate data (Data Sheet, Scenarios, etc).

Furthermore, you now have better visibility into each field through filters, columns, and a search function. This means you can search, sort, and filter features directly on the fields page to help locate the fields you need.

Below are all the new functionalities within the field settings page:
Lastly, you now can maintain your field list with bulk operations and the ability to hide fields. For example, hide less frequently used fields so you have a simplified list of fields from which to choose in your column chooser (in the Data Sheet view, Scenarios, etc.), and you can use bulk operations to easily group several fields to hide, archive, or delete them all at once. You can now also export the full list of field names and attributes as a .csv to review your fields in even more detail.

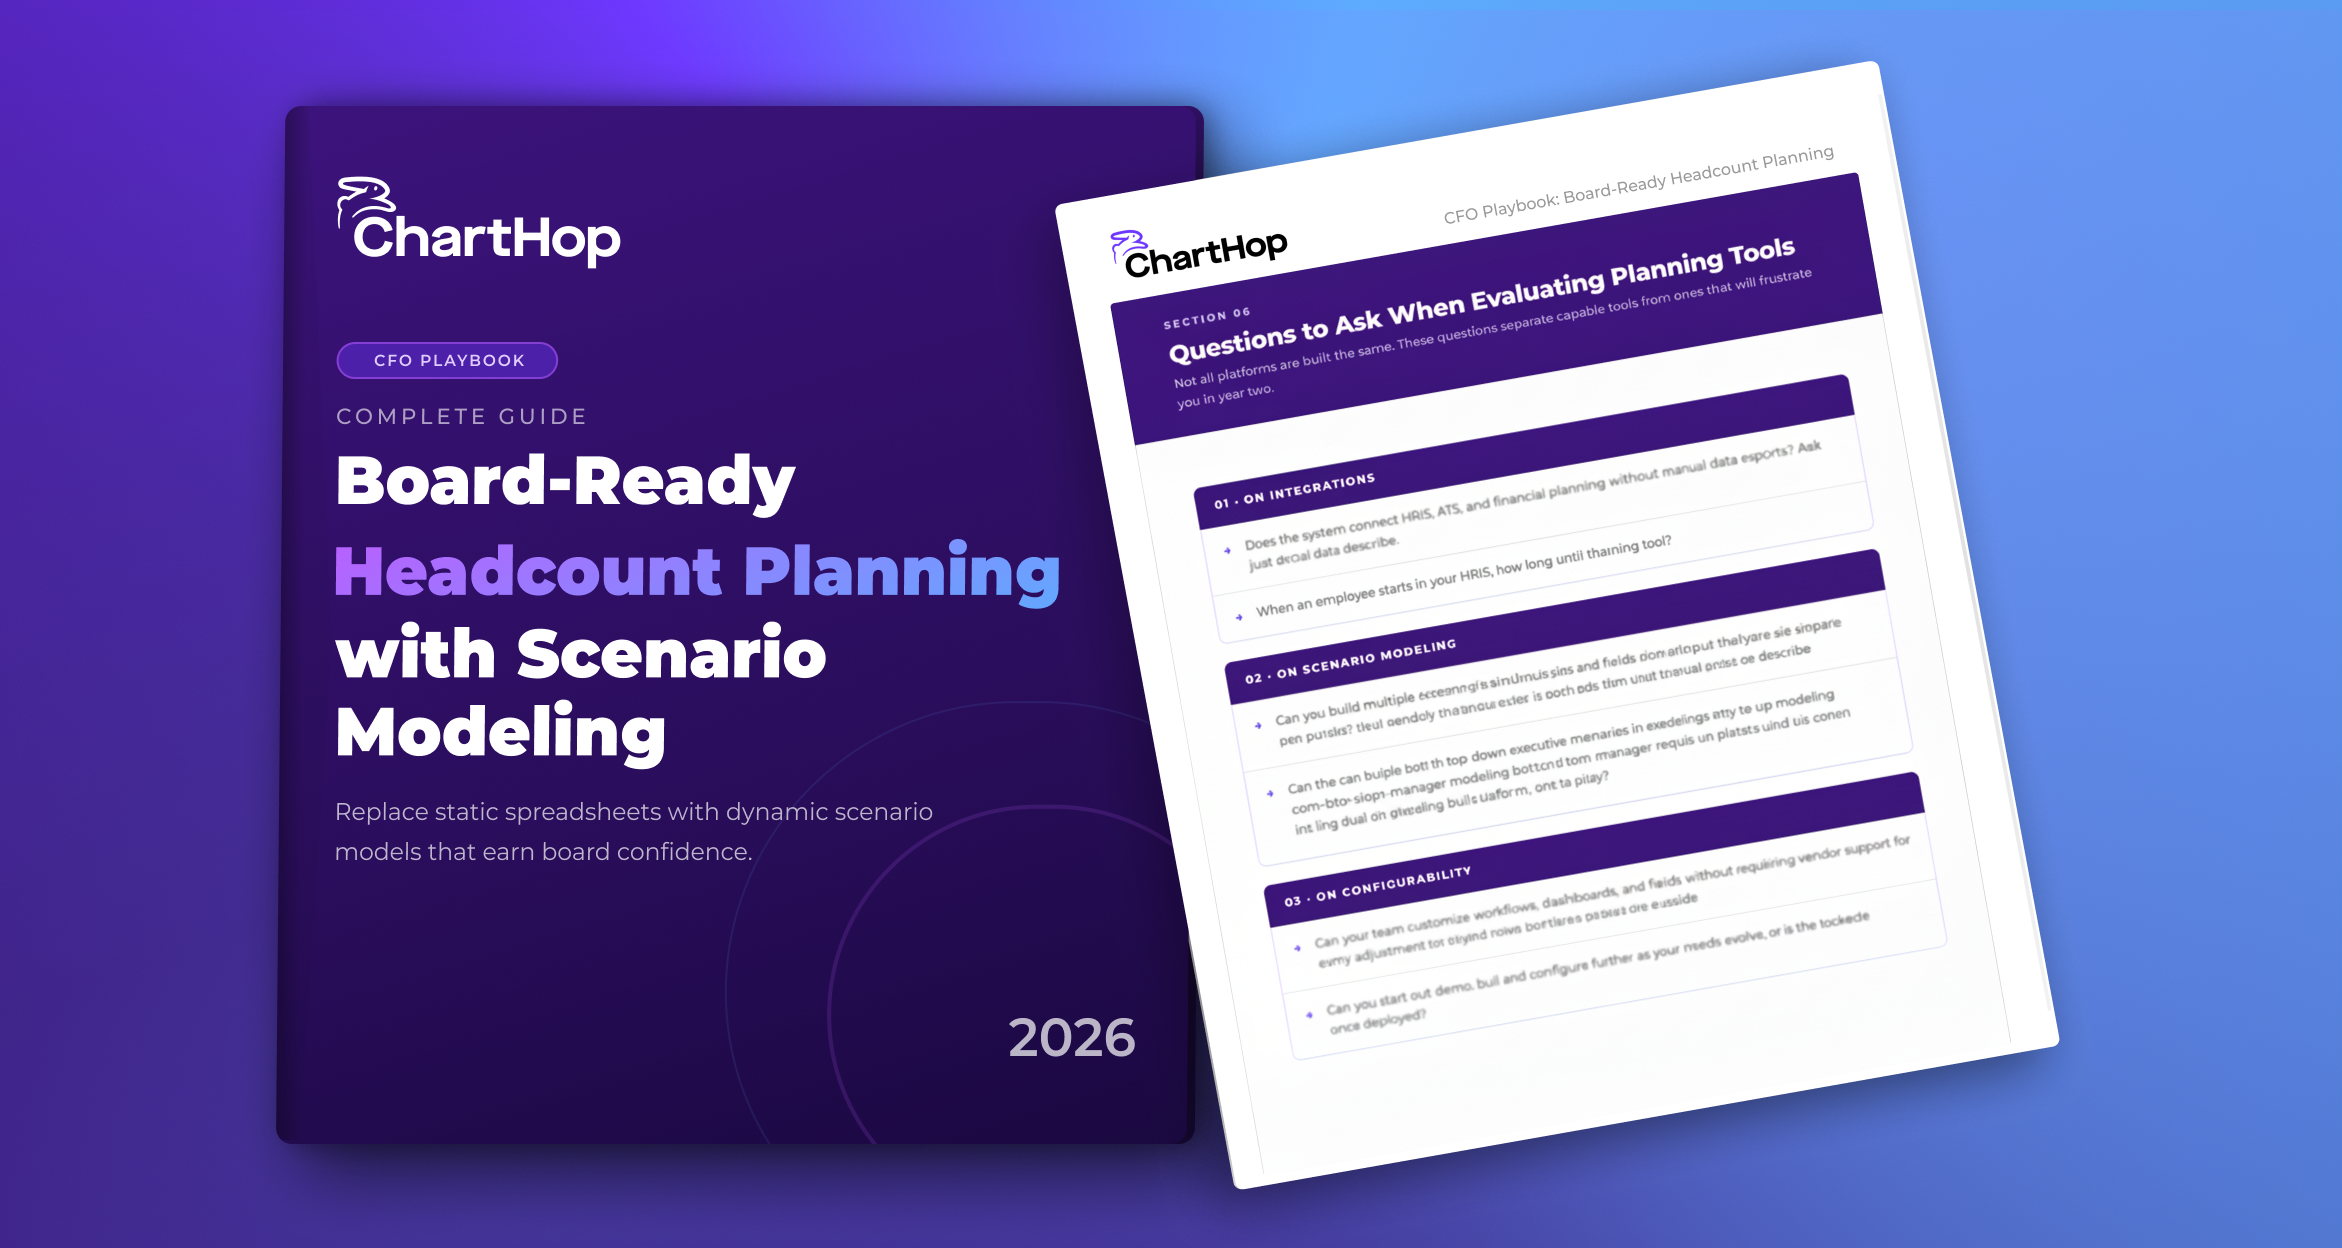

A CFO playbook for leaders who need to walk into board meetings with more than a single forecast — and leave with the board's confidence, not more questions.

See how AI-powered headcount planning helps HR and Finance teams build scenarios faster, model real-time budget impact, and make confident workforce decisions without the spreadsheets.

Learn how hybrid headcount planning combines top-down financial discipline with bottom-up operational knowledge — and why real-time scenario modeling and approval workflows make it work.

